Friday, May 6, 2011

Comic Book Titles


This is a Data Visualisation. The data here was collected and compiled from monthly reports released by Diamond Distributors from icv2.com and comichron.com.
This was a college project as part of my final year in BA in Multimedia, Cork Institute of Technology.

Please see previous posts for more information and images on the project.

Tuesday, April 26, 2011

Comic Book Titles Sales Data Visualisation 2005-2010

This is a data visualistaion of comic book sales figures from January 2005 until December 2010. Each balloon represents a comic book title released in that time. click images to see larger versions.

1/3 the size after click


Click here for the full image *(Warning! It's massive. 19,844 x 14032 pixels)

The bigger the balloon and the higher it floats represents how many issues in total that title sold over the time.
The further away from the left hand side of the image the balloon is, the more issues it had released.
Colour indicates publisher.
Red = Marvel
Blue = DC
Green = Image
Grey = Dark Horse
Pink = Everybody else

This is what the image looks like at 100% zoom (actual size)


At 50% zoom


This was created using the software Processing with data gathered from Diamond Distributors monthly sales reports in relation to comic book stores orders.

Wednesday, April 13, 2011

Week 11: Graffiti Research Lab

I've previously posted about some things related to graffiti. I discovered the  Graffiti Research Lab which led me to find some very interesting projects that they're involved in.


"Dedicated to outfitting graffiti artists and activists with open source tools for urban communication."


The first project I found interesting was Interactive Architecture. This would be categorised under projection bombing which is basically going out and projecting images and designs onto buildings in urban areas. Interactive Architecture then interacts with the surfaces it is projected on.

Please view the flickr gallery here as I can't embed. The projections here are interacting with circular windows that have the lights switched on inside.
See here for more, including a video displaying the impressive technique.


"The EyeWriter project is an ongoing collaborative research effort to empower people who are suffering from ALS with creative technologies.
It is a low-cost eye-tracking apparatus & custom software that allows graffiti writers and artists with paralysis resulting from Amyotrophic lateral sclerosis to draw using only their eyes."


Another open source project helping anyone who is paralysised with ALS (but beginning with famous LA graffiti artist Tempt1 who has ALS) to draw graffiti digitally using their eyes. The software and apparatus tracks the users eye to create 'eye art'.
The long-term goal is to create a professional/social network of software developers, hardware hackers, urban projection artists and ALS patients from around the world who are using local materials and open source research to creatively connect and make eye art.


eye art created by Tempt1 with EyeWriter


The follow video explaind and documents the whole project very well. The best part, I think, is when Tempt (destined to remain in a hospital bed for the remainder of his life) is using the EyeWriter while his live art is being projected in downtown LA.


http://www.eyewriter.org/


On the subject of Projection bombing, I discovered an unknown group (presumably Irish) that had tried this in Dublin. I found these on fuckflickr, an anti yahoo site that stands for non-commercial creative work. Some of the images reveal them to be anti-copyright and pro-open source, with Linux popping up, but alot of the rest are pointless cursing which seems a shame and a waste as something really cool could have replaced the time it was up.

IMG_0977

Find the rest of the gallery here

However, I think they did probably make those with the Laser Tag, which is a direct live graffiti projection, so the drawings aren't up for long anyway.
Flickr


Personally, I like these ideas for the basic reason that they make mundane buildings incredibly interesting and genuine spectacles.

Data Visualisation Project

Here's the latest incarnation of my project. To represent each comic book title in an abstract way I finally got it to make sense with balloons (thats pretty abstract right?)


Each balloon is a comic book title that's been released in the period between Jan 2005 and Dec 2010. This could mean it has been released every month, every 2 months, every 2 weeks etc, but not necessarily consistently each time. Some get cancelled, som get delayed and only might manage a few a year.

The colours represent different publishers:
Red = Marvel Comics (eg; Amazing Spider-man, X-men, Avengers)
Blue = DC Comics. (eg; Batman, Superman, Green Lantern)
Green = Image comics. (Spawn, Walking Dead)
Dark Grey = Dark Horse Comics ( Hellboy, Buffy the Vampire Slayer)
Black = Everyone else.

The Y-axis (how high the balloon is floating) reveals how much the title has sold. Higher = more.
The X-axis reveals how many issues of that comic were released. left = few, right =loads.

Also, the size of the balloon represents how much it has sold so larger = more.

The image is 2000x1000.

Sunday, April 3, 2011

Week 10: Interest Graph


This is a visualisation piece by Kunal Anand. It's called an interest graph. In the center is 'ME' (Anand). Arcing out from that are his interests. Overlayed on top of this are his friends, gathered from social network sites, with connections linking them to the interests. This reveals the different interests he shares with the friends.

The design is nice but what I find most interesting is how personal and unique this graph is to Anand. 

"....it's pretty clear to see how people you know are connected to things that you are interested in. "

This is another one made with more interest and friend nodes which creates some nice color effects with all the connections.


Kunal is the Lead Software Architect of 'Gravity', a new site currently under private Beta version. The interest graph is to be a major (or the major) feature of the site. Ex-myspace CEOs have founded it. This is it's mission statement: 
"Imagine a world ... where every website understands you and is organized for you ... where editorial decisions are intelligently guided by consumer interests ... where you're presented with less but higher quality information and advertisements ... we're helping build that world, starting by building your web."
It appears as though your facebook and twitter will be linked to your gravity and help shape your personal interest graph. Gravity is definitely something to look out for in the future as are these really cool looking interest graphs.

Quick interview with Anand here about Gravity and Interest Graphs.


Saturday, April 2, 2011

Avant Garde Project

Here's the latest results from my Avant Garde project. I was able to get the titles to display in relation to their estimated sales figure finally. The closer the name is to the bottom right hand corner, the more it is estimated to have sold and the bigger it's font.

(Created with Processing. Original Image sizes 8000x6000)

For these first few the colours remain random with a varying transparency.

2005:


2006:


2007:


2008:


2009:


2010

When I set the colours to be in relation to each comics publisher, the 2 sided-ness of the industry was revealed. Marvel are red and DC are blue. The resulting image is a jumble of both with Image comics barely visible in green and everything else in black. 

2010:


With the same data I represented the titles in circles.
2010:

My next step is to create a visualisation combining all the figures in one image. I have messed around with this using figures between 2005 and 2007. It was very intensive on my computer and the resulting image would spread off the canvas due to the high figures. I may likely do this on a college computer in the future as I thought I'd crashed my own last week.


Sunday, March 27, 2011

Week 9: A-Z of Tiny Blips and Short Clips

Daniele Manoli created a series of short videos based around the letters of the alphabet, with each one assigned a meaning. The videos are a mixture of experimental video, motion graphics and animation, and sometimes both.
Each one is very in and of itself with it's own style and distinction, which is a remarkable result for 26 shorts created by the same person over a year.
Some tie loosley to the given theme, others are very direct with it. Some are very short while others span up to 3 or 4 minutes.

Artist Description from longplay.fr - "DANIELE MANOLI is a self made director coming from graphism and motion design.
He is living in Hong-Kong where he created his own studio.
His work consist in mixing different technics ( Graph, Drawing, Painting, Photo and Video) therefore to obtain a special eye candy work in between stop motion and live action.
DANIELE believes in experimentation."

Here's a selection of some I found particularly good.

L:

This video, although looking very animated, is made entirely from cut out shots of neon lights in Hong Kong. I think this one is my favorite, but it's hard to call.


S:

This one is almost a short movie, supposedly commenting on how 'the industry' works.


Q:

One of the more abstract ones but very impressive, cool video effects.


O:

Really cool motion graphic effects for this. Just really liked the overall result of it.


F:

Strange, vague and nice looking animation


I think what I liked most about this project was the fact that Manoli wasn't tied down to anything, style or content (either within or between each video), once the vague structure was decided. If someone else decided to create something using the same foundation of 26 shorts with letters of the alphabet, something completely different would be created. I would actually like to see more people to apply this to a project and see the results. It was a nice piece to come across and soon realised I had seen a music video of his before this also. (first video here)


To see the whole collection click here. Each one is well worth a look
http://www.behance.net/DanieleManoli

Saturday, March 19, 2011

Week 8: Playaround NYC

Noel Billig is a Technical Creative Director at R/GA. They are an agency that are involved with anything to do with technology. Ad Campaigns, visual design, building apps and much more. Visit their site for more.


Noel has a blog called DoesNotCompute. Here I discovered his latest post which is an app he created which visualises New York city playgrounds. It was submitted to the NYC Big Apps contest. The visualisations are based off each playgrounds rating.

"The first step was assigning playgrounds a quality rating. Currently quality is determined by nearness to major and minor truck routes. Major truck routes cause a slightly greater loss in quality than minor truck routes. Major truck routes affect playgrounds within 300 meters while minor truck routes only affect playgrounds within 200 meters. "

Other steps are used to determine the apps rating of a playground.
"The second step involves sampling points regularly on the map. The nearest playgrounds, walking distance to these playgrounds, and the quality of these playground are then determined. These factors are combined to assign each point an overall rating which estimates how well that area is supported by playgrounds.
Next, the various support ratings are interpolated to generate the PLAYAROUNDNYC playground support map."


Monday, March 14, 2011

Initial Data Vis Results

Here's some images I created using Processing. The data, at the moment, is an excel file of a list of each comic book title released in since 2005. That is, each title that made it into the top 300 of the month it was released.

There are 18944 titles listed here. At the moment, the size, position, colour and opacity are random.
If nothing else I could say that the images highlight the many, many comic book titles available each month.
I'd hope to incorporate the sales figures of titles into the images somehow to give them some structure. The average sale of a single issue a month nowdays is between 80,000 and 120,000 roughly. Back in the mid-90's the average was over a million.
Still, some pretty cool results so far. The images are 6000x4000 in size.


These are how the images appear on screen at 100% zoom:


The actual complete images:


Sunday, March 13, 2011

Week 7: Super Uber Interactive Multimedia Projects

Super Uber are a company in Brazil that combine a creative design style with technology projects. They created the first multi-touch table in Brazil and have participated in exhibitions and festivals including the 2006 World Cup in Germany and Open Air in Portugal.
They create multimedia and interactive projects for culture, education, entertainment and advertising.
Below are some examples:

The Minas Gerais – Vale Memorial concept, in Belo Horizonte, presents the state’s history using multimedia and interactive resources. The interactive project of the Memorial has a sophisticated technology set up for a large museum, with over 30 rooms. The innovative interfaces are specially made for the text, videos, animations and sounds of the Museum. The project also includes some interfaces where people can access content through iPhone, iPod touch and iPad.


Sportv Set design: this is the first projection mapping set on a television station in Brazil and possibly the world. SuperUber created a very unique physical shape to project graphics, video and animations on as well as being able to control the lighting effects of the piece. A portion of the surface can be selected to host a video segment also.
"The new format allows for a reporter to appear in human scale, standing upright within one of the projected columns, and interact with the presenter as if they were in the same location. The project creates an original dialog between the set, live video feeds, animations, software, synchronization, projection, and lighting design."


Multimedia project for Embratel store in Rio de Janeiro. "SuperUber did the multimedia project for the first Embratel store, in Rio: interactive tables, projections and the installation Connections, where the visitors get visually connected by lines projected on the floor."


Open Air Festival Brazil and Portugal. Interactive installations.


These are just a few of the many really cool projects undertaken and I encourage you to visit the SuperUber site and check out more.

Sunday, March 6, 2011

Week 6: Flags as Info Graphics

Is it week 6 already?.........

This was a campaign for Portuguese political magazine 'Grande Reportagem', by Lisbon design firm 'Foote Cone & Belding'.
They turned flags of various countries into infographics by adding information in a legend in each image.

Brazil:

Green - people who live on less than $10/mth
Yellow - people who live on less than $100/mth
Blue - people who live on less than $1000/mth
White - people who live on more than $100 000/mth


U.S.A:

Red: In favor of the war in Iraq
White: Against the war in Iraq
Blue: Don't know where Iraq is


The E.U:

Blue - petrol (gas) consumption
Yellow - petrol (gas) production


China:

Red - minors at 14 years old who work
Yellow - minors at 14 years old who study
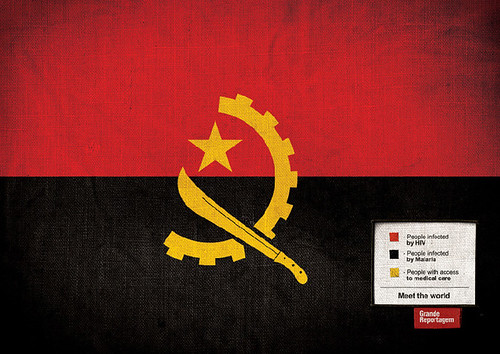

Angola:

Red - people infected with HIV
Black - people infected with Malaria
Yellow - people with access to medicine


Columbia:

Red: Exportation of bananas
Blue: Exportation of coffee
Yellow: Exportation of cocaine


Somalia:

Blue - women who suffer genital mutilation
White - woman who don't suffer genital mutilatio


Burkina:

Red - people that die before age one
Green - people that die before age three
Yellow - people that reach adulthood


The legitimacy of these percentages has been questioned, or even proven wrong, on most sites and forums I've seen these. However, I do think the point of the campaign was to highlight very important issues.
I have seen other flag design done similarly but I think they aren't part of the campaign and weren't made by the FCB design group.

first discovered topic here.


http://www.newsdesigner.com/archives/002152.php